Riparian vegetation along the Rio Grande Corridor over time

    How do I read the map?

    Prefer to learn from video? Watch the demo video here.

    The size of each circle symbol represents the estimated vegetation cover per site for the year displayed. The data used provides a coverage value for each vegetation species which was estimated using sum intercept length. For each year, per site, all species estimated coverage values were added together. This value was used in a formula to create the symbol’s radius creating a proportional symbols map. The larger the symbol, the greater estimated vegetation cover. The exact value used for vegetation can be found by clicking on each symbol. Additionally, the color of each symbol represents the amount of precipitation received at each site for the year displayed. Generally, the darker the blue, the greater the precipitation value. Feel free to pause the timeline and manually click through the years. You can pan and zoom around the Rio Grande corridor to see all the mapped features.
    About this project

    This web map seeks to illustrate an estimation of riparian vegetation cover along the Rio Grande Corridor. This app supplements the vegetation distribution with precipitation. Precipitation impacts the riparian ecotones. The developers found precipitation important as the Southwest is projected to grow dryer in the upcoming decades. This app also seeks to show the variance in riparian vegetation over time, by displaying unique proportional symbol maps for each year between 2000-2015.
    This map is made for anyone interested in New Mexico ecozones, vegetation change over time and environmental change during the current period of global warming. The developers seek to illustrate the effects of human-caused climate change to riparian regions of the Rio Grande Corridor over a recent 15-year span. This map can be used by legislators, educators and anyone interested in environmental change. Please see our citations to see where the data was obtained and learn more about riparian area conservation in New Mexico.
    Please click here to read more about riparian trees in New Mexico.

    Contact us

    Team member: Katie Slack - katieslack824@gmail.com
    Team member: Francisco Logan - franciscologan00@gmail.com
    Team member: Emily Smith - ecsmith1912@gmail.com
    Project advisor: Dr. Liping Yang (course instructor of GEOG 485L/585L Internet Mapping)

    Citations
    • "Riparian, Aquatic and Wetland Restoration on the Carson, Cibola and Santa Fe National Forests and Kiowa National Grasslands."" (2019). United States Forest Service. Online: Link
    • Wyland, S. (2021, 30). "Riparian restoration plan approved for New Mexico’s national forests."" Santa Fe New Mexican. Online: Link
    • Vegetation Cover 2000-2015. From Bosque Ecosystem Monitoring Program (BEMP). University of New Mexico, Albuquerque, NM. Online: Link. Retrieved March 1st, 2022.
    • Precipitation 1997-2017. From BEMP. University of New Mexico, Albuquerque, NM. Online: Link. Retrieved March 1st, 2022.
    • “New Mexico Carbon Dioxide Emissions from Fossil Fuel Consumption” (1970-2019). United States Energy Information Administration. Independent Statistics & Analysis. Online: Link
    • Vladimir Agafonkin. "Leaflet.js". Javascript Library.(2010-2022). Online: Link
    • JJ Jin(ptma) & contributors. “Leaflet.Legend”. Github Repository.(2020). Online:Link
    • Jonathan Skeate(skeate) & contributors. "Leaflet.timeline". Github Repository.(2015). Online:Link
    • Open Street Map Contributors. "OpenStreetMap". Online: Link
    • Vitaly Gorbachev. Icons8. River Favicon. River icon by Icons8
    Line graphs

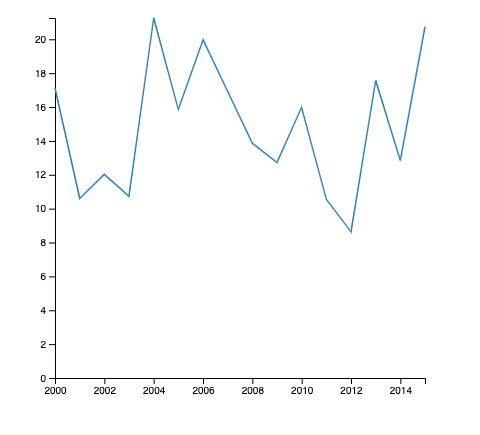
    Vegetation in New Mexico from 2000-2015 in centimeters

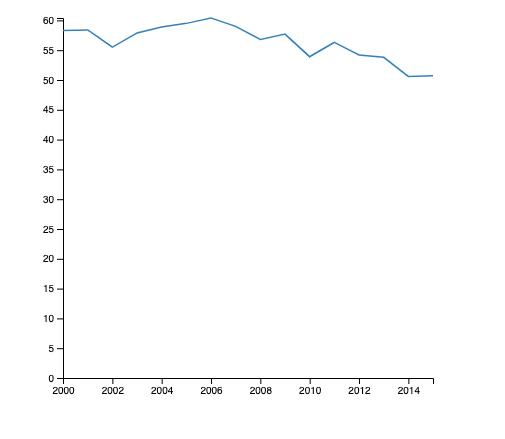
    Precipitation in New Mexico from 2000-2015 in milimeters

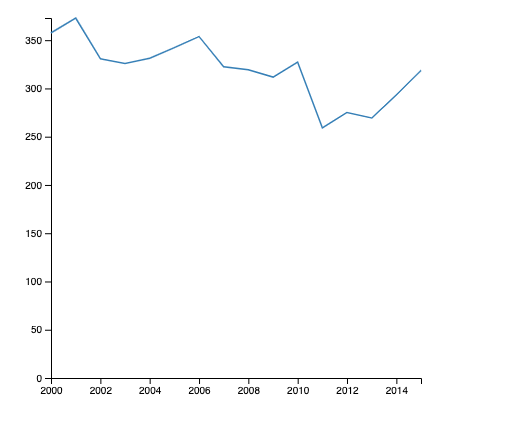
    CO2 emissions in New Mexico from 2000-2015 in million metric tons PPM